Featured Datasets
Recent
View all →- Producer Price Inflation (PPI)
- Local Government Election seat allocations 2000-2021
- Buildings completed in South Africa: floor area and dwellings by province and type of building
- Building plans passed in South Africa: value by province and type of building
- Building plans passed and buildings completed in South Africa
- Tourist accommodation in South Africa: Income by type
-
The South African prime lending rate as set by the South African Reserve Bank. Data is daily lending rate.
DS0388 Economy & BusinessCoverage:
-
The Rand to Dollar exchange rate per day, which is a weighted average of the banks' daily rates at approximately 10:30 am. Weights are based on the banks' foreign exchange transactions.
DS0331 Economy & Business south africacurrencyCoverage:
- Producer Price Inflation (PPI)
South African annual price inflation (PPI), monthly.
DS0466 Economy & Business south africaproducer price inflationinflationCoverage:
-
Seats won by each party on every South African municipal council (metropolitan, local and district) in the 2000, 2006, 2011, 2016 and 2021 local government elections. Each row is one party's seats on one council in one election, split into ward seats and proportional representation (PR) seats, with the council's province, code and type.
DS0479 Politics & Elections electionslocal governmentcouncilspolitical partiesmunicipalitiesCoverage: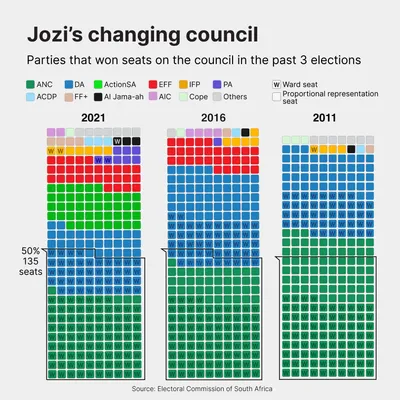
- Buildings completed in South Africa: floor area and dwellings by province and type of building
How many new homes, and how much new floor space, larger municipalities recorded as completed each month since January 2000, for South Africa and each of the nine provinces. It counts completed dwelling-houses (smaller than 80 square metres, and 80 square metres or more) and flats and townhouses, and gives the floor area in square metres of these and of other completed buildings: other residential buildings, office and banking space, shopping space, industrial and warehouse space, and additions and alterations. Because it measures buildings actually finished rather than planned, it shows the new supply of homes and commercial space reaching the market, and the split by house size shows the balance between smaller and larger homes.
DS0490 Economy & Business housingproperty marketinfrastructurebuilt environmentCoverage:
- Building plans passed in South Africa: value by province and type of building
The value of building plans passed by larger municipalities each month since January 2000, for South Africa and each of the nine provinces. Plans passed are an early indicator of construction: they show what has been approved to be built before work starts. The value is broken down by type of building (houses smaller than 80 square metres and 80 square metres or more, flats and townhouses, office and banking space, shopping space, industrial and warehouse space, and additions and alterations), so you can see where new housing is planned and which provinces are attracting commercial and industrial development. Values are in rands at current prices, not adjusted for inflation.
DS0487 Economy & Business constructionhousingproperty marketbuilt environmentCoverage:
- Building plans passed and buildings completed in South Africa
How much building work South Africa's larger municipalities approve and see completed each month, measured by value, since January 2000. Building plans passed show what developers, businesses and homeowners have permission to build, so they signal where construction is heading; buildings reported as completed show what was actually finished, usually many months later. Both are given for all buildings and split into residential buildings, non-residential buildings (such as offices, shops and factories) and additions and alterations. Every series comes at current prices and at constant 2019 prices, which remove the effect of inflation so years can be compared fairly, and in both actual and seasonally adjusted form.
DS0486 Economy & Business constructionhousingbuilt environmentproperty marketCoverage:
- Tourist accommodation in South Africa: Income by type
Total income of tourist accommodation in South Africa each month since January 2007, in rand, for the industry as a whole and by type of accommodation. Total income is income from accommodation, restaurant and bar sales, and other income. Actual and seasonally adjusted figures at current prices.
DS0482 Economy & BusinessCoverage:
- Tourist accommodation in South Africa: units available
Stay units available in tourist accommodation in South Africa each month since January 2007, for the industry as a whole and by type of accommodation. A stay unit is a room, apartment, chalet or camping site.
DS0484 Economy & BusinessCoverage:
- Tourist accommodation in South Africa: stay unit nights
Stay unit nights sold by tourist accommodation in South Africa each month since January 2007, for the industry as a whole and by type of accommodation. A stay unit is a room, apartment, chalet or camping site. Actual and seasonally adjusted figures.
DS0480 Economy & BusinessCoverage:
- Tourist accommodation in South Africa: Occupancy rates
The occupancy rate of tourist accommodation in South Africa each month since January 2007: stay unit nights sold as a share of stay unit nights available, for the industry as a whole and for hotels, caravan parks and camping sites, guest houses and guest farms, and other accommodation. Actual and seasonally adjusted figures.
DS0035 Economy & Business south africatourismCoverage:
- Tourist accommodation in South Africa: Income per unit/night
Average income per stay unit night sold by tourist accommodation in South Africa each month since January 2007, in rands, for the industry as a whole and by type of accommodation. Actual and seasonally adjusted figures at current prices.
DS0481 Economy & BusinessCoverage:
- Tourist accommodation in South Africa: Income by source
Income of the South African tourist accommodation industry each month since January 2007, in rand, split into income from accommodation, from restaurant and bar sales, and other income. Actual and seasonally adjusted figures at current prices.
DS0483 Economy & BusinessCoverage:
- Tourist accommodation in South Africa: full stats
Every series in the Stats SA tourist accommodation survey since January 2007 in one long table: stay units available, stay unit nights sold, occupancy rate, income per stay unit night sold, and income from accommodation, restaurant and bar sales, other income and total income, for the industry as a whole and by type of accommodation. Actual and seasonally adjusted figures.
DS0485 Economy & Business tourismhospitalityCoverage: - Unemployment and the Labour Force
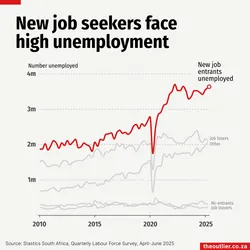
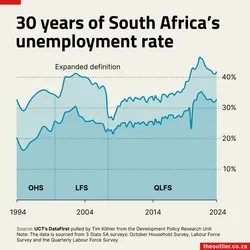
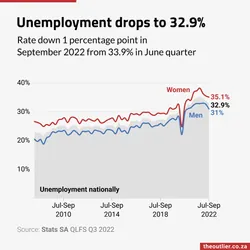
Statistics South Africa publishes the figures which provide the national unemployment rate as part of the Quarterly Labour Force Survey. This national survey breaks down the working age population (people between age 15-64) into two main categories - those counted as part of the labour force' and those 'outside of the labour force'. The official unemployment rate is the proportion of the labour force that is unemployed. But this rate doesn't account for the population that are of working age, but are categorised as 'outside the labour force'. ‘Discouraged workers’ - i.e people who are unemployed but could not find a job and have given up trying to, are one such category of people not accounted for in the unemployment rate. Stats SA therefore also publishes various other ‘labour underutilisation’ (LU) measures in order to more accurately measure the labour market. These include measurements for time-related underemployment, and the ‘potential labour force’. Note the following categories that the data is broken down into 1. Working-age population = Labour force + Outside the labour force 2. Labour force = Employed + Unemployed 3. Outside the labour force = Potential labour force + Other outside the labour force 4. Potential labour force = People who are seeking work but unavailable for it + People who are available for work, who are not actively seeking it, including 'Discouraged-job-seekers'.
DS0468 Demographics & Society workforceunemploymenteconomyCoverage:


-
Votes and share of total valid votes won by every party and independent candidates in all 257 of South Africa's municipalities (metros, local and district municipalities) in the 2021 local government elections. Source: IEC.
DS0476 Politics & ElectionsCoverage: - Social grant expenditure in South Africa
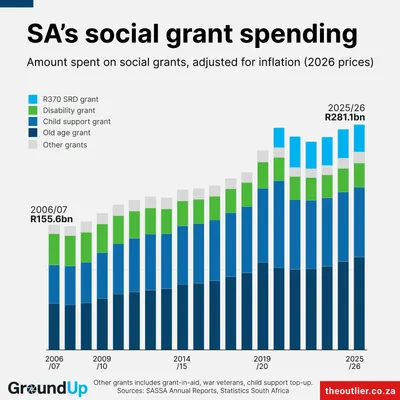
This dataset contains the amount spent per social grant per year by the South African government.
DS0478 Demographics & SocietyCoverage:
- City of Johannesburg Household Municipal Bills
A typical Johannesburg household’s monthly municipal account under the city’s tariffs: property rates, electricity, water, sanitation and refuse removal, plus VAT. These figures are provided in the City of Joburg's budget books: Under the Municipal Finance Management Act, South African municipalities must include 'Table SA14: Household bills' to show what a typical household’s monthly municipal account would be under the city’s tariffs These example municipal bills are provided by the City of Joburg for 3 tiers of household types: 'middle-income', 'affordable', and 'indigent' household. The city defines the hypothetical household they use for each case - Johannesburg’s “middle-income” sample household owns a property valued at R700,000 and uses 1,000 kWh of electricity and 30 kilolitres of water a month. Affordable = property value R500,000; 500 kWh electricity; 25 kl water usage Indigent = property value R300,000; 350 kWh electricity and 20 kl water usage Because the household stays the same each year, changes in the bill reflect changes in tariffs, not in how much people use.
DS0477 Economy & BusinessCoverage:
- Rooftop solar installed in South Africa
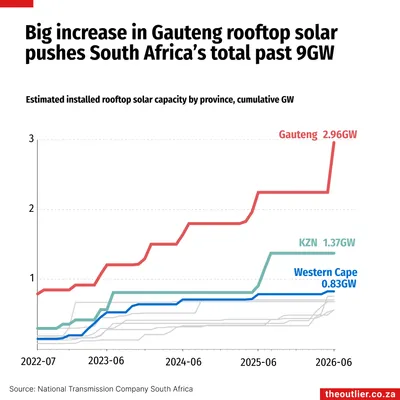
This dataset contains Eskom's estimates of rooftop photovoltaic solar capacity installed in South Africa and its nine provinces. Rooftop PV includes rooftop, ground-mounted and other behind-the-meter PV installations.
DS0099 Energy solarCoverage:

- Renewable electricity on national grid in South Africa
The annual contribution of renewable energy on the national grid in MWh as metered by the National Transmission Company South Africa (NTCSA). Renewable electricity sources are concentrated solar power (CSP), photovoltaic and wind. Most of this electricity is generated by independent power producers who have contracts with Eskom or the NTCSA. At present Eskom operates only one wind farm.
DS0225 Energy electricityeskomrenewable energyCoverage:

- Eskom energy availability factor in South Africa, by week
Weekly Energy Availability Factor (EAF) percentage across Eskom power stations, representing the proportion of available generation capacity. Excludes electricity generated by independent power producers (IPPs), renewable energy sources, and imported power.
DS0199 Energy electricityeskomsouth africaenergy availability factorpower generationweekly dataCoverage:
-
Voter turnout in the 2021 local government elections. Turnout for every ward. Using the 2021 ward demarcations.
DS0472 Politics & Elections electionslocal governmentvoter turnoutCoverage: - Minimum wage in South Africa
The historical minimum wage in South Africa from 2019. The National Minimum Wage Act came into effect on 1 January 2019. The rates are per hour in ZAR.
DS0471 Economy & Business employmentworkforceCoverage:
- Consumer prices in South Africa
A list of food, baby, household and pet items surveyed by Statistics South Africa each month to determine the cost of living for people living in South Africa.
DS0165 Economy & Business cpisouth africastatistics south africaconsumer priceCoverage: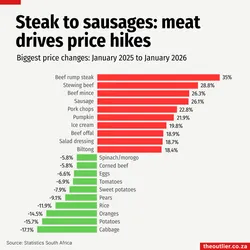
-
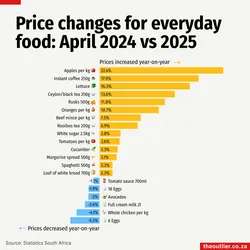
The consumer price index (CPI) is the official measure of inflation in South Africa. This dataset is updated monthly.
DS0128 Economy & Business cpiconsumer pricesouth africaCoverage:
- Cost of Household Food Basket in different areas
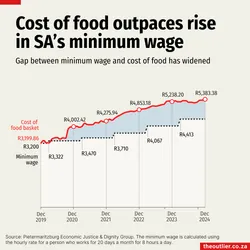
Description: The monthly cost of a basket of food that a low-income South African household of seven people typically tries to buy each month. The basket was designed by the Pietermaritzburg Economic Justice & Dignity Group (PMBEJD) with women living on low incomes, based on the foods and quantities they say they aim to secure. It contains 44 food items. It reflects what households actually buy under tight budgets, not an ideal diet, and is not nutritionally complete. Women shoppers collect the prices from the supermarkets and butcheries that serve low-income areas, and it reflects their choices in switching to cheaper brands or stores in order to find specials, meaning the data represents what households really pay each month. This data is published monthly as part of the Household Affordability Index.
DS0467 Economy & Business food povertyfoodcost-of-livinggrocery-basketinflationCoverage:
- Voter registration, turnout in local government elections, municipality level, South Africa
This dataset contains the number of registered voters, the number who voted (voter turnout) and the percentage who voted (%voter turnout) in each of South Africa's local municipalities in five local government elections - 2000, 2006, 2011, 2016 and 2021. Elections are held every five years. Only registered voters can vote.
DS0376 Politics & Elections electionssouth africaCoverage: -
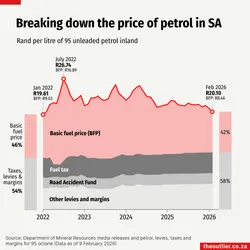
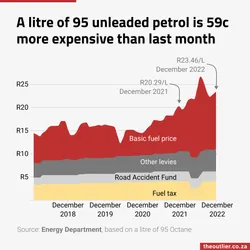
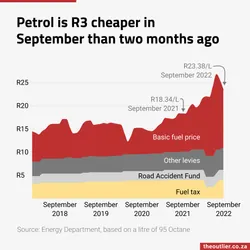
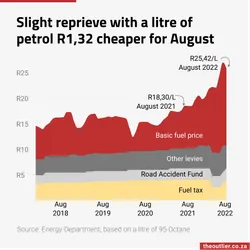
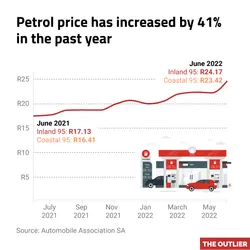
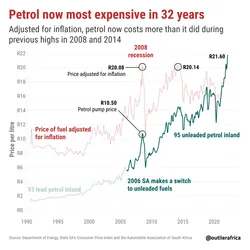
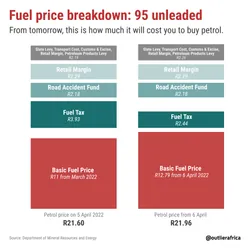
The basic fuel price per month for a litre of 95 octane inland, including various taxes levied. Data starts 2006.
DS0150 Economy & Business south africapetrolCoverage:

- GDP per capita (world)
Gross Domestic Product (GDP) per capita in current US dollars for all countries and various regional and economic groups. Gross domestic product is the total income earned through the production of goods and services in an economic territory during an accounting period (in this case, annually). Here it has been divided the general population of each country / group to achieve a per capita estimate. The values are expressed in 'current' (also known as 'nominal') prices, meaning the values provided for each specific year reflects the prices of that year, without adjusting them to remove the effects of inflation over time. The values are expressed in United States dollars.
DS0301 Economy & Business gdpeconomic indicatorseconomyCoverage:
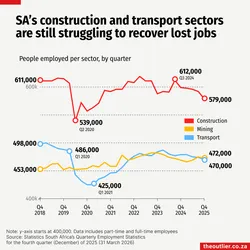
- People employed by sector in South Africa, by quarter
The number of people employed in South Africa in specific industries. The employment numbers in this dataset combine both part-time and full-time employees. The data is sourced from Statistics South Africa's Quarterly Employment Statistics (QES) in selected industries: The Quarterly Employment Statistics are the findings of an enterprise survey conducted by Stats SA based on samples drawn from private non-agricultural businesses (factories, firms, offices and stores), as well as from national, provincial and local government entities to measure employment figures
DS0334 Economy & Business employmentsouth africastatistics south africaworkforceCoverage:
-
Solar panel imports from China to South Africa (measured in megawatts), based on data from Ember, which sources it from the General Administration of Customs of the People’s Republic of China. Data is available from 2017.
DS0068 Energy chinasouth africasolarelectricityCoverage:


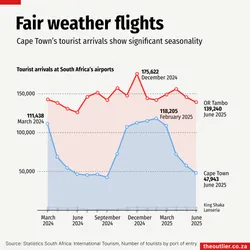
- Arrivals of tourists in South Africa, by month and major airport
The number of tourists arriving in South Africa through one of the four major international airports OR Tambo, Cape Town, King Shaka and Lanseria by month.
DS0323 Transport & Infrastructure cape townjohannesburgsouth africatourismCoverage:
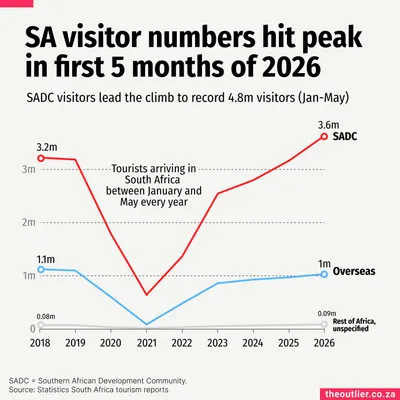
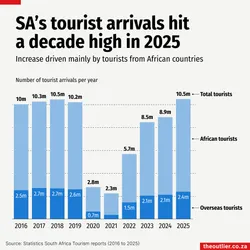
- Tourists arriving in South Africa, by month
The number of tourists arriving in South Africa each month by air, sea and land
DS0146 Economy & Business tourismsouth africatravelarrivalsCoverage:
- South Africa's greenhouse gas emissions by sector
South Africa's greenhouse gas emissions broken down by five key sectors: energy, industrial processes and product use (IPPU), agriculture, waste, and land use, land use change and forestry (LULUCF).
DS0423 Climate & Environment greenhouse gas emissionssector emissionsclimate changeCoverage:
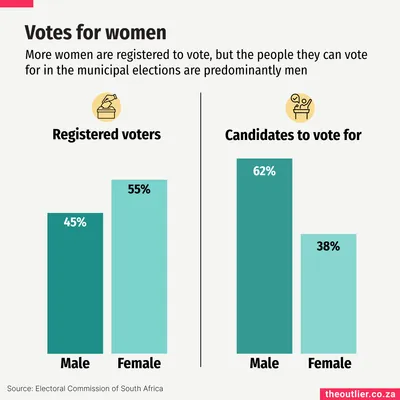
- Registered voters in South Africa's 2026 local government elections
This dataset contains the number of people registered to vote in the 2026 municipal elections broken down by sex and age categories as at 2 September 2026.
DS0411 Politics & Elections south africaelectionsmunicipalitiesvoter registrationlocal governmentCoverage:

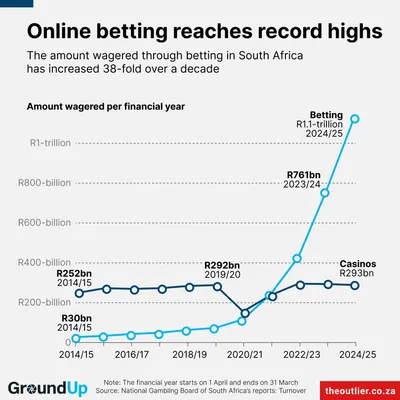
- Gambling turnover in South Africa
Annual rand value of total money wagered (turnover) in South Africa across financial years (1 April to 31 March). The dataset is segmented by gambling sector: casinos, betting, bingo, and limited payout machines (LPMs).
DS0329 Economy & Business south africagamblingCoverage:

- Labour absorption rate by province
The labour absorption rate is the proportion of the working-age population aged 15 to 64 years that is employed. It is also known as the employment-to-population ratio.
DS0107 Economy & Business employmentpopulationlabour absorption rateworkforceCoverage:
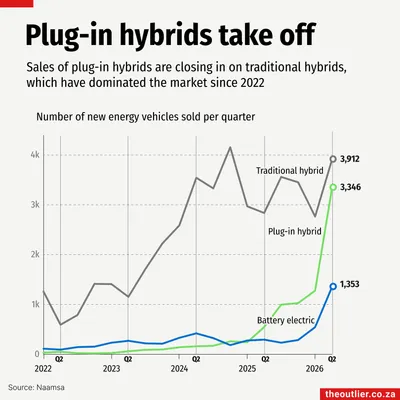
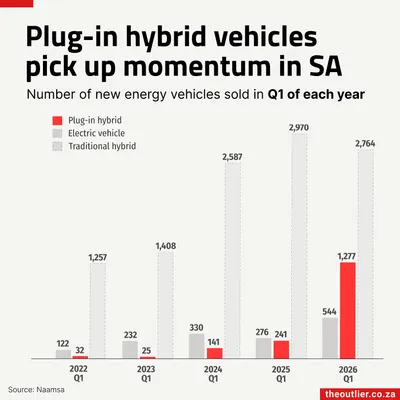
- New energy vehicle sales in South Africa
Sales numbers of plug-in hybrids, traditional hybrids and plug-in electric vehicles by financial quarter from 2022 in South Africa.
DS0367 Transport & Infrastructure south africaelectric vehicleshybrid vehiclesvehicle salesCoverage:
- GDP growth rate, annual, South Africa
South Africa's annual GDP growth rate (in constant 2015 prices) Gross domestic product is the total income earned through the production of goods and services during an accounting period. The GDP growth rate represents the percentage change over each previous year of the constant price.
DS0214 Economy & Business south africagdpeconomic growthCoverage:
-
Quarter on quarter pecent change in South Africa's gross domestic product. Constant 2015 prices, seasonally adjusted
DS0412 Economy & Business south africagdpeconomic growthCoverage:
- Solar panel imports from China into African countries
Cumulative generation capacity, measured in megawatts (MW), of solar photovoltaic panels exported from China to African countries.
DS0364 Energy africasolar energysolarrenewable energyrenewablesCoverage:
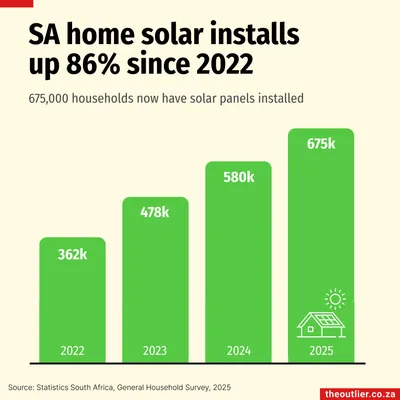
- South African households that have solar panels
The number of South African households that own one or more solar electric panels
DS0370 Energy south africasolarCoverage:
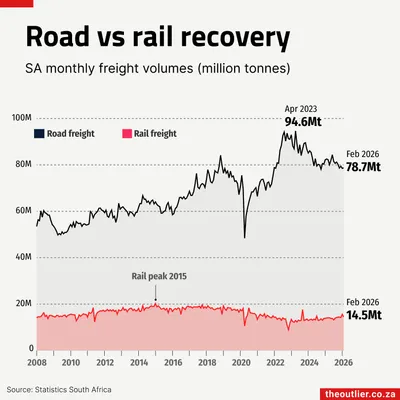
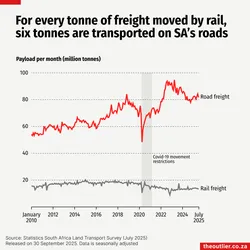
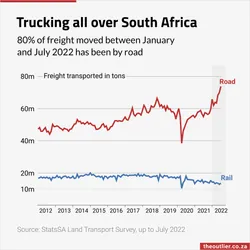
- Volume of freight moved by road and rail in South Africa
Monthly seasonally adjusted freight payload moved by road and rail, measured in metric tonnes. From Statistics South Africa's Land Transport Survey.
DS0126 Transport & Infrastructure road freightroad and railfreight transportland transportCoverage:
-
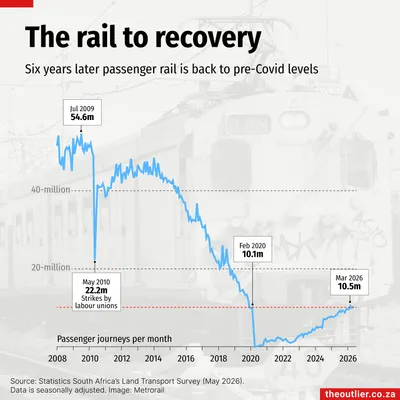
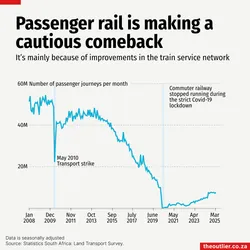
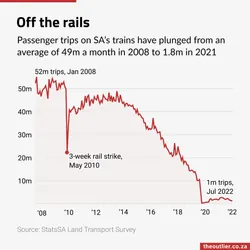
Monthly seasonally adjusted passenger rail journeys, measured in passenger trips.
DS0062 Transport & Infrastructure public transportrail transportpassenger journeysCoverage:
- South Africa's greenhouse gas emissions
This dataset contains the total greenhouse gas emissions including and excluding land use, land use change and forestry (LULUCF) as published in the Department of Forestry, Fisheries and the Environment's Draft 10th national greenhouse gas inventory
DS0422 Climate & Environment greenhouse gas emissionsnational inventoryclimate changeCoverage:
-
The total number of rhinos poached per year in South Africa, including a breakdown of rhinos poached in the game reserves run by South African National Parks (SANParks), eg, Kruger National Park, as well as rhinos poached in province-run and private game reserves by province.
DS0056 Climate & Environment south africawildliferhinopoachingCoverage:

- Eskom greenhouse gas emissions
Greenhouse gas emissions released by South Africa’s main electricity prducer, the state-owned utility Eskom. Emissions include total emissions as well as carbon dioxide (CO₂), methane (CH₄) and nitrous oxide (N₂O). Data is from the Draft 10th National Greenhouse Gas Inventory Report 1990-2024
DS0032 Climate & Environment eskomfossil fuelelectricitygreenhouse gasemissionsclimateCoverage:
- Population of South Africa's provinces by age - StatsSA
This dataset is from the Statistics South Africa's Mid-year Population Estimates 2026. It includes total population estimates for each province as well as estimates for 17 age cohorts for mid-2026
DS0419 Demographics & Society age cohortspopulation estimatesprovincialCoverage:

- Population of South Africa by age cohort - StatsSA
This dataset is from the Statistics South Africa's Mid-year Population Estimates 2026 dataset. It includes total population as well as estimates for 17 age cohorts for 2002 to 2026
DS0414 Demographics & Society population estimatesage groupsannual estimatesCoverage:
-
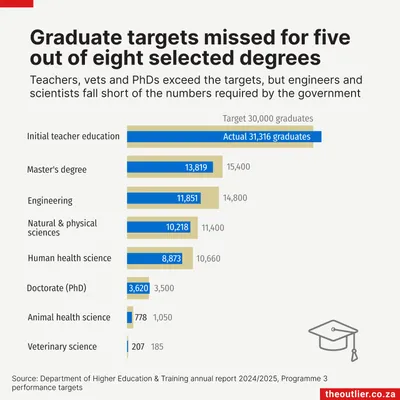
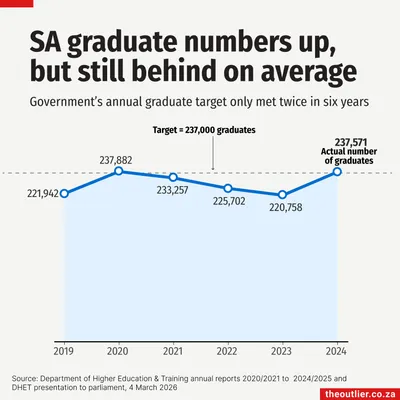
The annual number of graduates from South Africa's public universities covering eight key areas: engineering, natural and physical sciences, human health sciences, animal health sciences, veterinary sciences, initial teaching education, masters degrees and doctorates (all subjects). The data comes from the Department of Higher Education and Training's annual reports, except for the 2024 data, which was sourced from a DHET presentation to a parliamentary committee in March 2026.
DS0362 EducationCoverage: