
 Dashboard



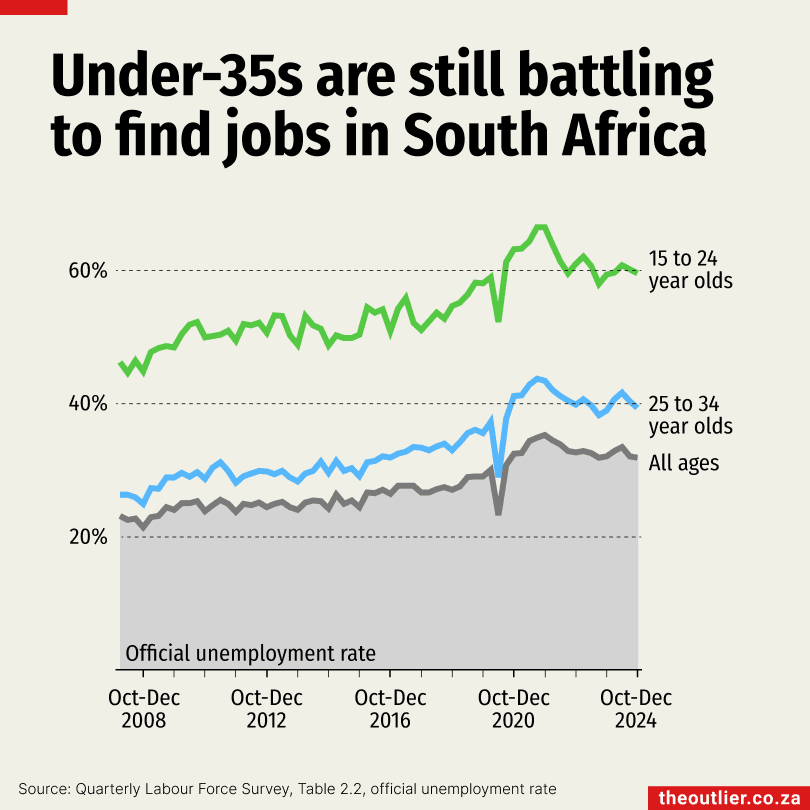
This chart is one possible view of this dataset — you'll find other chart options below if they are available. You can find the full dataset and metadata at the bottom of the page.
These charts are based on dataset DS0138 - Unemployment and the Labour force - by age group
Stats SA's Quarterly Labour Force Survey (QLFS) defines the working age population as aged 15-64. This dataset breaks down this population into the following age brackets: ages 15-24; 25-34; 35-44; 45-54; and 55-64. The survey counts the number of working-age people within the labour force (employed or unemployed) and outside of the labour force (those who can't work or are not looking for work). In addition to these population counts, the data also provides rates that look at specific labour-related breakdowns as a percent of a population such as the official Unemployment Rate which counts the number of unemployed people as a share of the number of people in the labour force. Other additional indicators of 'labour underutilisation' (LU) are provided alongside this because the unemployment rate does not account for populations such as 'under-employed' workers or the 'potential labour force'.
- Time period covered
- 2008 to 2026
- Time-series breakdown
- Quarterly
- Geographic coverage
- South Africa
- Source
- Statistics South Africa
Preview the full dataset below.
| date | variable | all_working_age | age_15-24 | age_25-34 | age_35-44 | age_45-54 | age_55-64 |
|---|---|---|---|---|---|---|---|
| 2008-03-31 | Population | 31544000 | 9693000 | 8516000 | 6171000 | 4414000 | 2751000 |
| 2008-03-31 | Labour Force | 18808000 | 3060000 | 6537000 | 4866000 | 3114000 | 1233000 |
| 2008-03-31 | Employed | 14438000 | 1644000 | 4817000 | 4071000 | 2768000 | 1138000 |
| 2008-03-31 | Unemployed | 4371000 | 1416000 | 1720000 | 795000 | 345000 | 94000 |
| 2008-03-31 | Outside the Labour Force | 12736000 | 6633000 | 1979000 | 1306000 | 1300000 | 1518000 |
| 2008-03-31 | Labour force participation rate | 59.6 | 31.6 | 76.8 | 78.8 | 70.5 | 44.8 |
| 2008-03-31 | Employed / population ratio (Absorption) | 45.8 | 17 | 56.6 | 66 | 62.7 | 41.4 |
| 2008-03-31 | Inactivity rate | 40.4 | 68.4 | 23.2 | 21.2 | 29.5 | 55.2 |
| 2008-03-31 | LU1- Unemployment rate | 23.2 | 46.3 | 26.3 | 16.3 | 11.1 | 7.6 |
| 2008-03-31 | LU2 - Combined rate of unemployment and time-related underemployment | 26.8 | 49.3 | 29.6 | 20.5 | 15.2 | 11.2 |