
Subscribe to download data and additional chart formats.
Republish this chart? Charts must be used as is — no customisation, editing or cropping. The Outlier logo must remain on the chart unchanged.
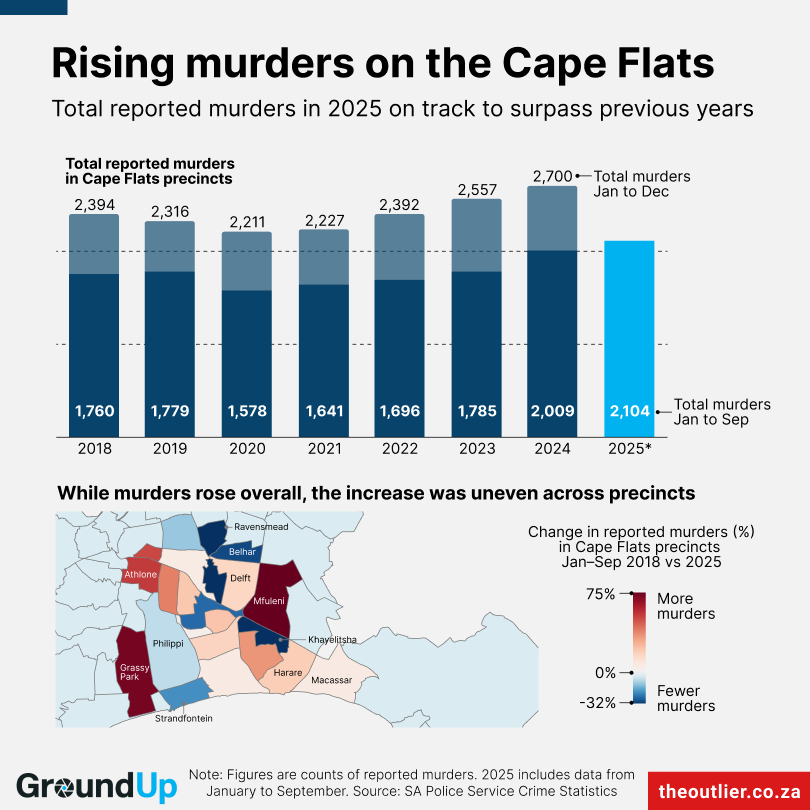
Police figures for October to December 2025 are not yet available, but in the first nine months of the year, 2,104 murders were reported to police stations on the Cape Flats. That’s a 20% increase since 2018, when 1,760 murders were reported between January and September.
Cape Town’s population has probably grown by a similar percentage based on census figures.
The Cape Flats’ suburbs are notoriously gang-ridden and face high youth unemployment. Murders on the Cape Flats make up 75% of all murders reported in the City of Cape Town district between January and September 2025.
The rise in murders shows a failure of the state to get the problem under control. This is despite a dedicated anti-gang unit and other strategic operations by SAPS, and additional law enforcement deployment by the provincial government and the City of Cape Town.
See the full story and statistics at GroundUp.